

Oats

Let’s look at Oat applying my technical analysis across multiple timeframes.
This one is worth a read as one can apply this analysis to every commodity.
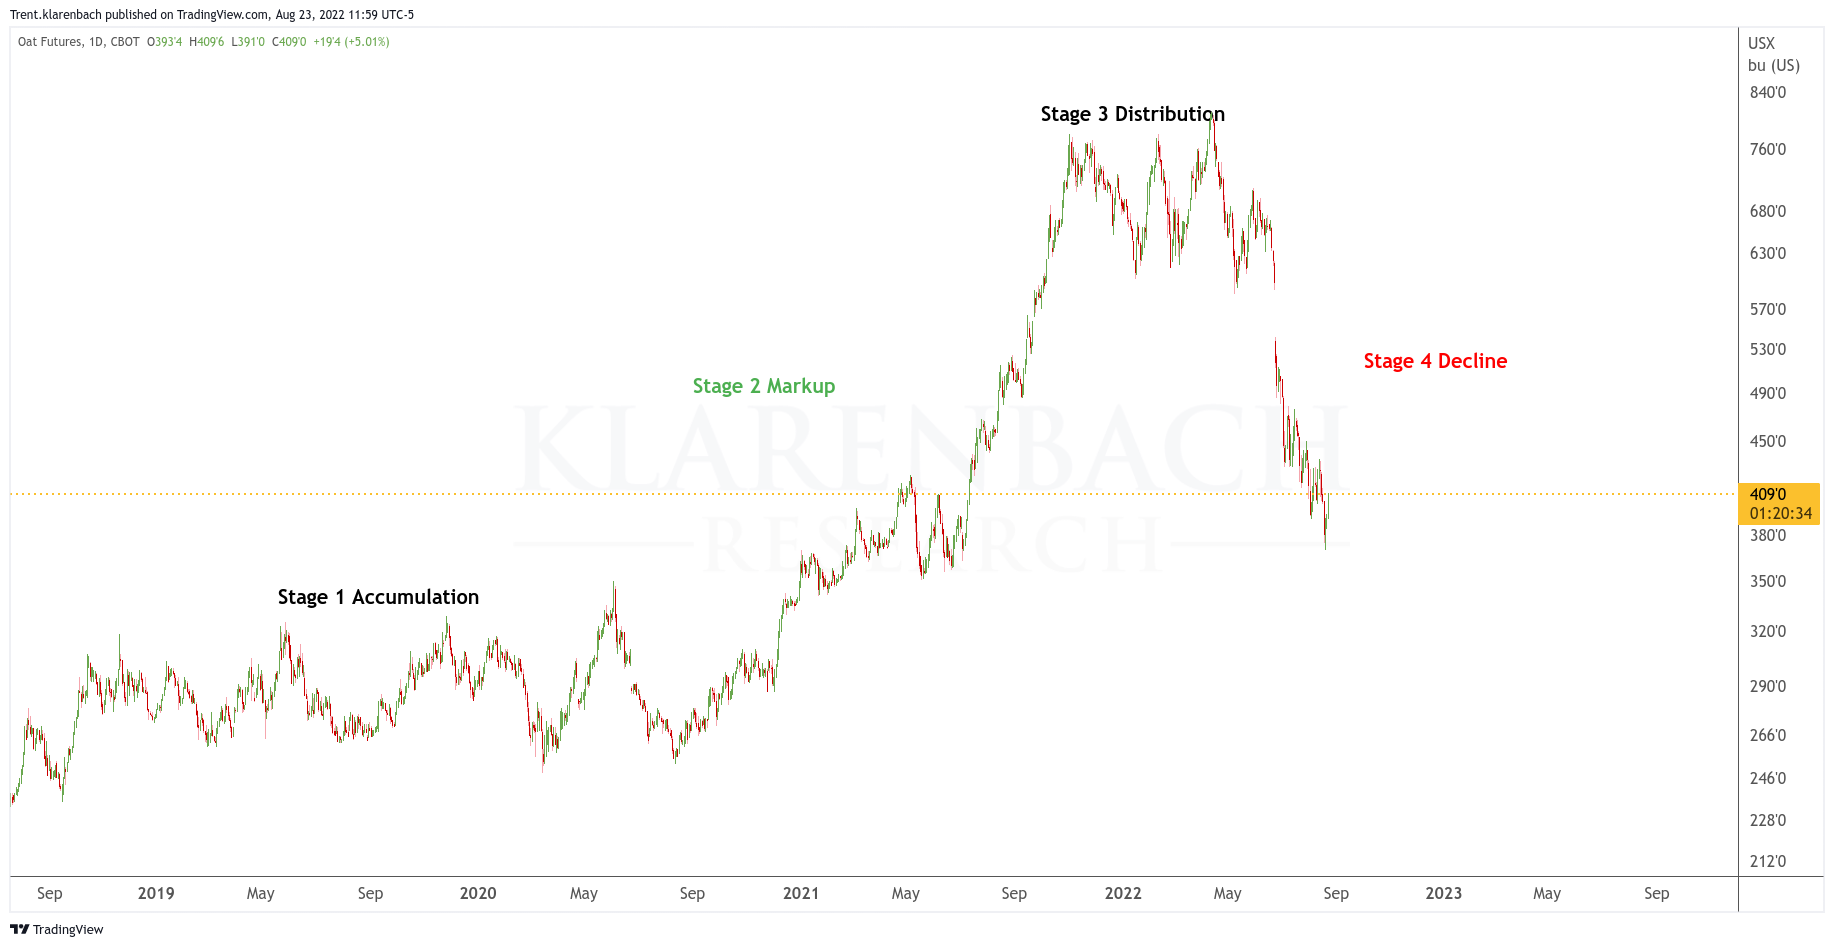
The Oat Futures Continuous chart below displays the extreme volatility of the past year.
Hopefully, you were able to ride this up through the Stage 2 Markup getting out during the Stage 3 Distribution avoiding the Stage 4 Decline.
This chart is an excellent example of a market cycle found in all assets in all time frames.
My December 1, 2020 Oats analysis stated how I was bearish below 713.
Let’s dig deeper with my multiple timeframe analysis.
The Monthly Continous Chart with annotations is next.
Keep reading with a 7-day free trial
Subscribe to Klarenbach Grain Report to keep reading this post and get 7 days of free access to the full post archives.