Oats have been the grain markets' darling, with a meteoric 100% rise in price in 2021.
Let us look at a few Oat charts to see if we can get a perspective of where prices will go from here.
First, the Monthly chart.
The monthly chart clearly shows the parabolic rise in prices following the breakout above the two-year resistance early in the 2021 calendar year.
My price target of 713 was met in October.
I now anticipate some consolidation or retracement in the price.
I am Bullish above 713 and Bearish below 713.
The weekly chart below shows that this week is forming the largest red candle since May 2021.
While the week is not over yet, and we do not know how it will end, this is a poor start.
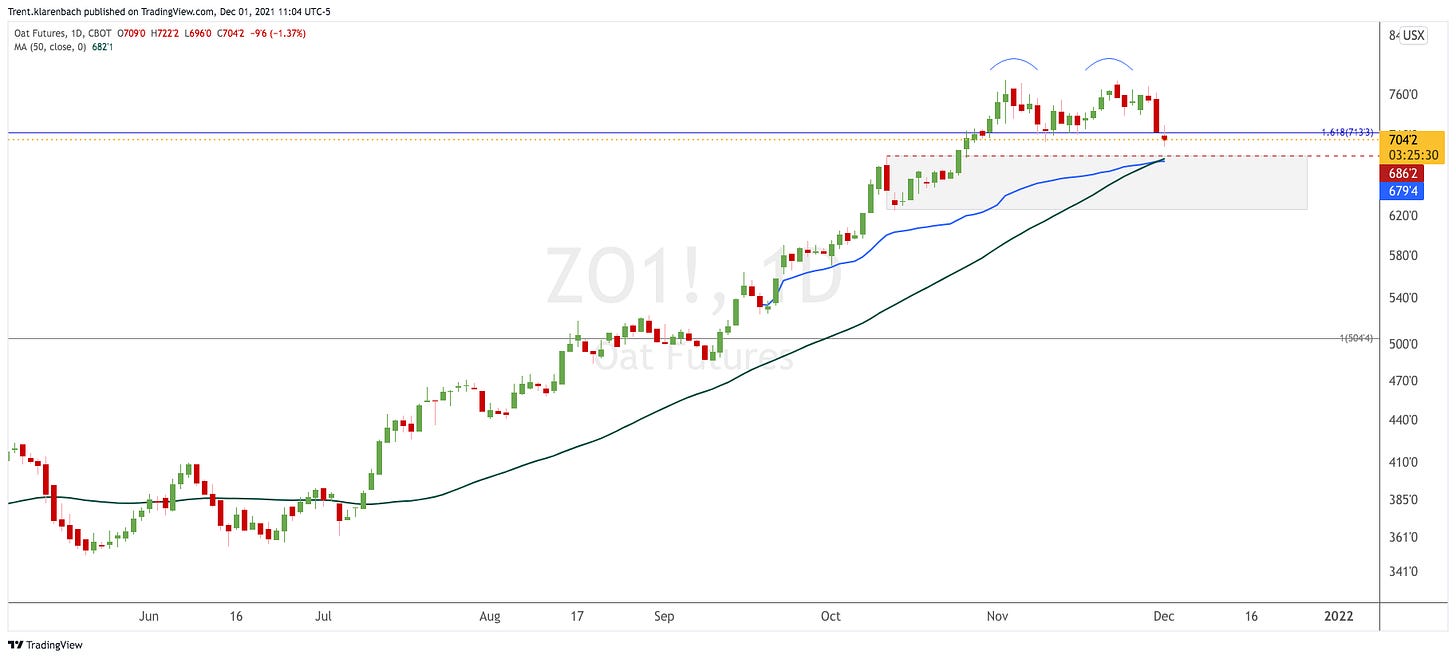
The daily chart below has Oats completing a double-top with a break of 713, suggesting a decline in prices.
I have shaded a level of interest of previous supply that could act as support.
Notice the confluence of the green 50 Day Moving Average (DMA) and the blue Volume-Weighted Average Price (VWAP) from the September 20 low with the previous high on October 12.
Each of these indicators is within my shaded level of interest, which suggests that the price decline will slow down or find support.
A long position holder will consider taking full or partial profits with the double-top completion and certainly reducing their exposure upon a daily close below the blue VWAP and green 50 DMA.
Again, I am Bullish above 713 and Bearish below 713.


