This morning, I was asked about July Oats.
This is a free publication to demonstrate our grains and special crops analysis.
Let us look at some charts.
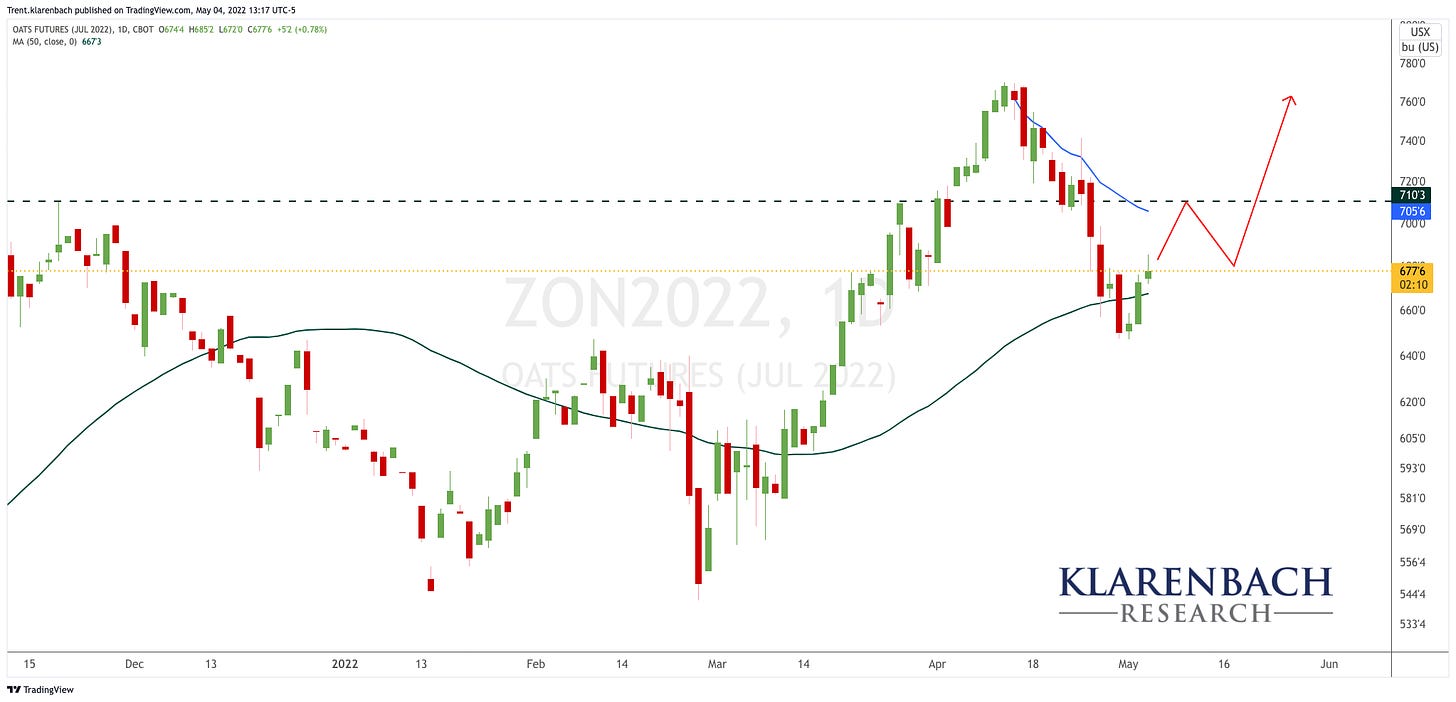
July Oats Futures - Daily Chart
We would to see the price above the 2021 high of 710 and the blue Anchored Volume-Weighted Average Price (VWAP) from the April high.
The Anchored Volume-Weighted Average Price (VWAP) measures the average price adjusted for volume for a period of time.
The red arrow suggests a possible price path getting rejected at the confluence of the 2021 high and the blue VWAP before continuing higher.
If this occurs, our stop would go beneath the blue VWAP and the higher low.
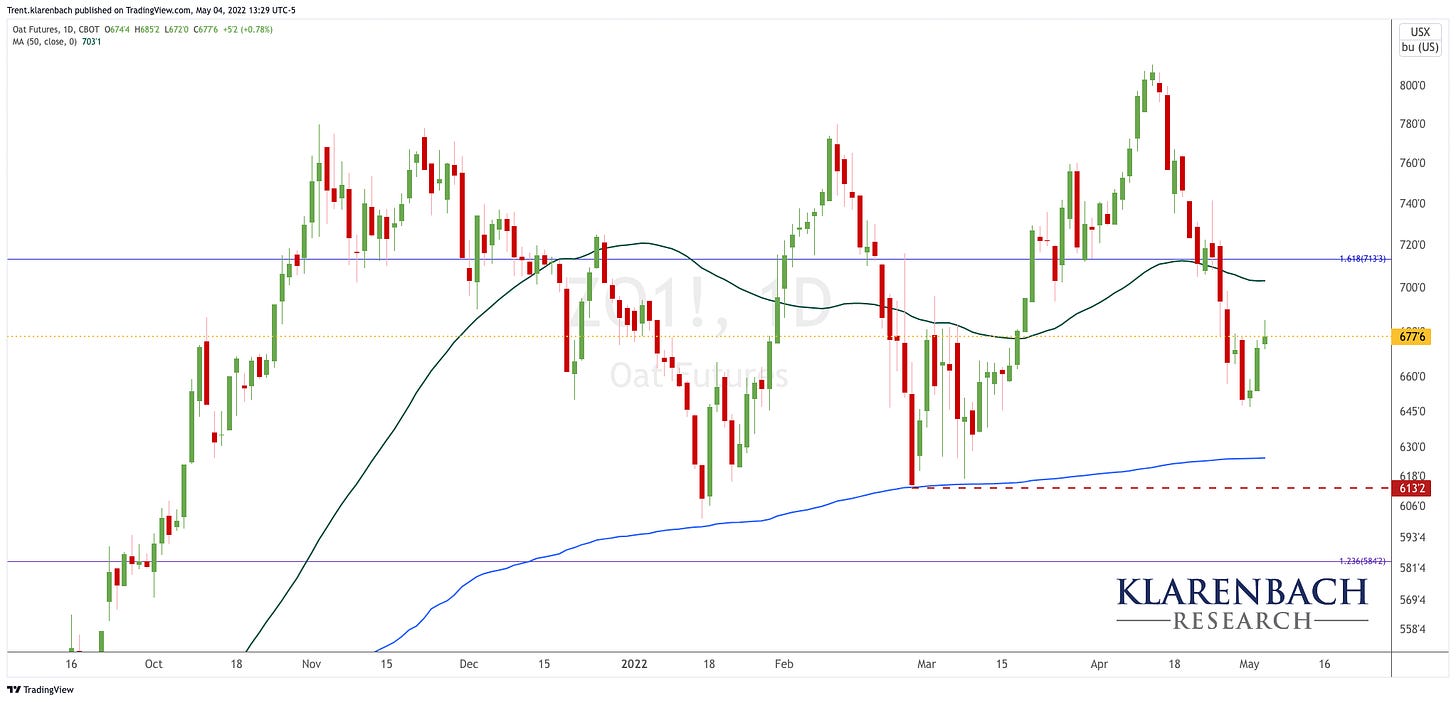
Oats Futures - Continous Chart
The continuous Chart is below the green 50 Day Moving Average (DMA).
We don’t trust a chart below a 50 DMA.
We would like to see it above a rising 50 DMA and the 713'3 before becoming bullish.
Currently, we don’t have a low-risk, high-probability entry.
Oats are in what we refer to as a No-Trade Zone


