

July 2022 Canola Futures
July 2022 Canola Futures
Grain Market Technical Analysis

Yesterday, we discussed Nov 2022 Canola Futures.
Today, we take a look at the July 2022 Futures Contract.
As a reminder, readers can track our commodity-specific analysis in two places:
Klarenbach Research website
Let’s look at some charts.
*****Click on the image to enlarge*****
JULY 2022 Canola Futures
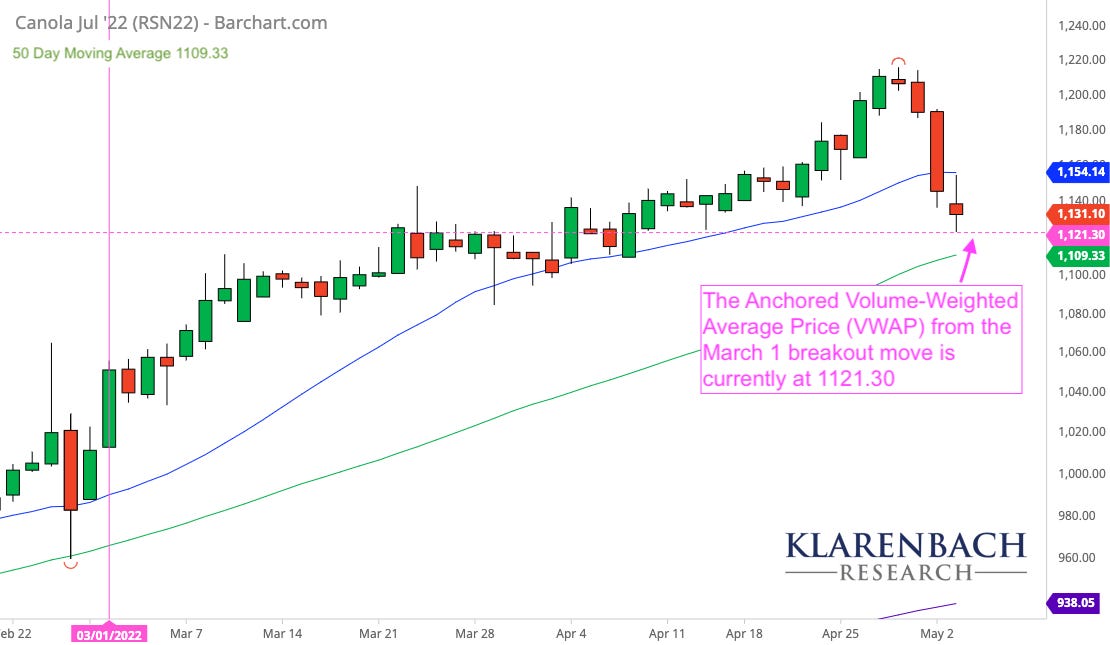
Since the closing high on April 27th, the past three days have brought us three days of ugly red candles.
The price is currently between the blue 20- and green 50- Day Moving Averages (DMA)
Buyers are stepping up in the area of previous supply.
Previous resistance often acts as support.
As labelled, the horizontal pink dotted line represented the current Anchored Volume-Weighted Average Price (VWAP) from the March 01 breakout move.
The VWAP represents the average price paid per contract since March 1.
The average long contract position is profitable above that line and feels good about their position.
Below that line, they are losing money and are likely to exit, pushing the price lower.
Notice how the low of today’s candlestick wick low is at the VWAP.
We use the VWAP to identify levels of interest that often act as support or resistance.
Yesterday, Manitoba Ed and I monitored how the Nov Canola contract reacted to a key VWAP to avoid capitulation selling near the reversal.
Identifying these levels of interest can assist in keeping our emotions in check.
They don’t always work out; however, the VWAP is my favourite sentiment indicator.
It is still acting as support at today’s close.
