A local farmer buddy asked me to look at Hard Red Spring Wheat.
This analysis will look at the MGEX Hard Red Spring Wheat March 2022 contract.
This link will track this idea on TradingView Hard Red Spring Wheat
Next week, I will look at the SW Saskatchewan Basis, providing that perspective to producers.
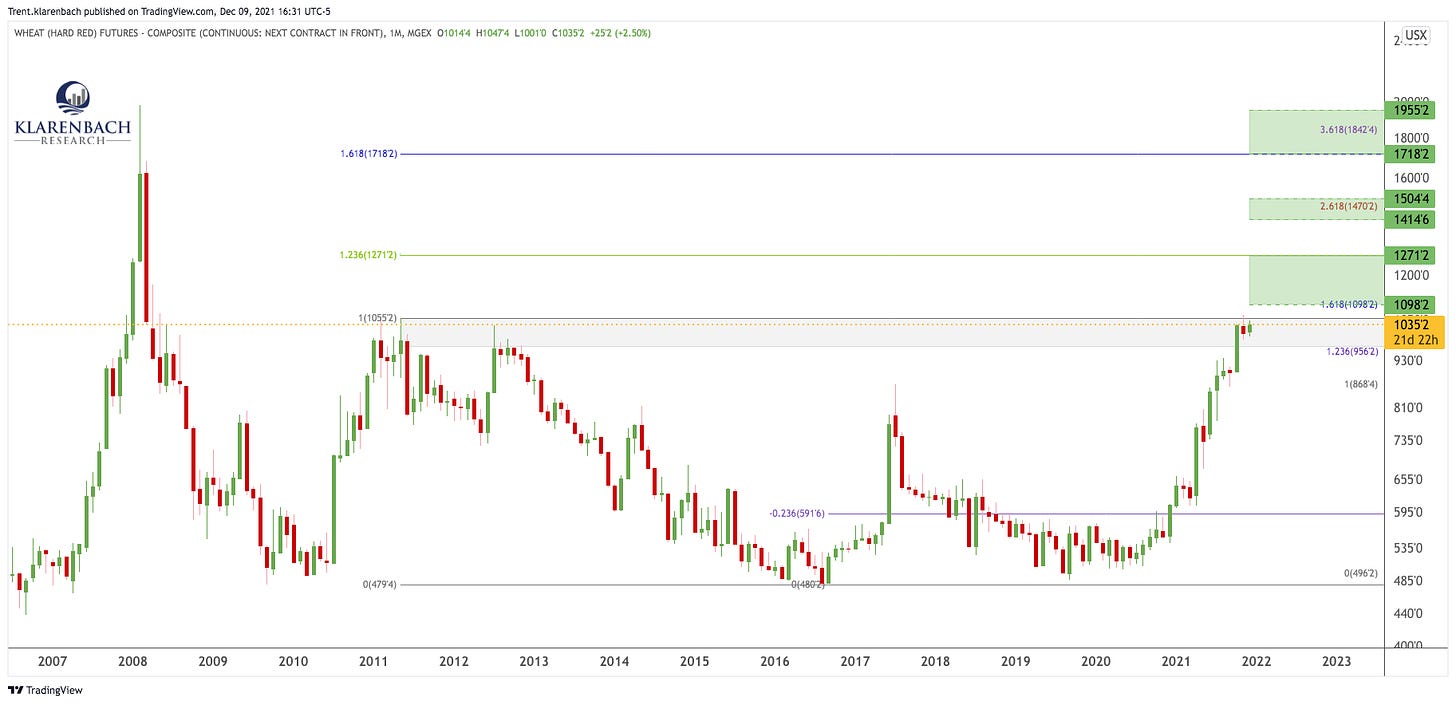
Monthly MGEX Composite (Continuous: Next Contract in Front) chart below:
The price is currently at a previous resistance level from 2011 and 2012, highlighted by the grey box.
This move from 2020 is extended, and this level of supply is a logical place for the price to settle down.
This price level is being tested for the third time, weakening with each test as supply is absorbed.
If the price can get above 1055, I have several targets marked by the green rectangles with the price levels along the right axis in green.
I am bullish above 1055 and bearish below that price level.
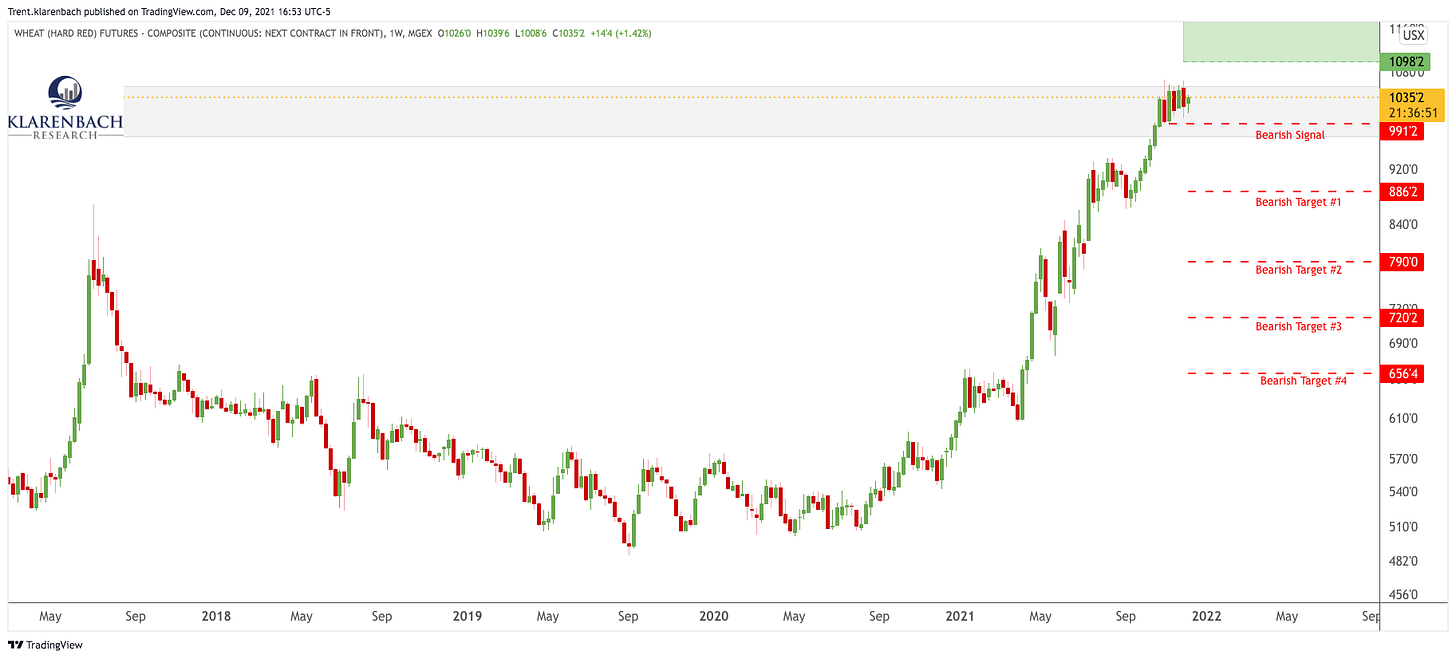
The weekly chart is up next.
As I am bearish below 1055, I labelled my bearish signal level and used the Fibonacci Retracement tool to identify bearish targets that may act as support.
Each bearish target was determined from the 0.236, 0.382, 0.500 and 0.618 Fibonacci Retracement levels using the 2020 low and the current 2021 high.
I will reassess IF and once a level of interest is reached.
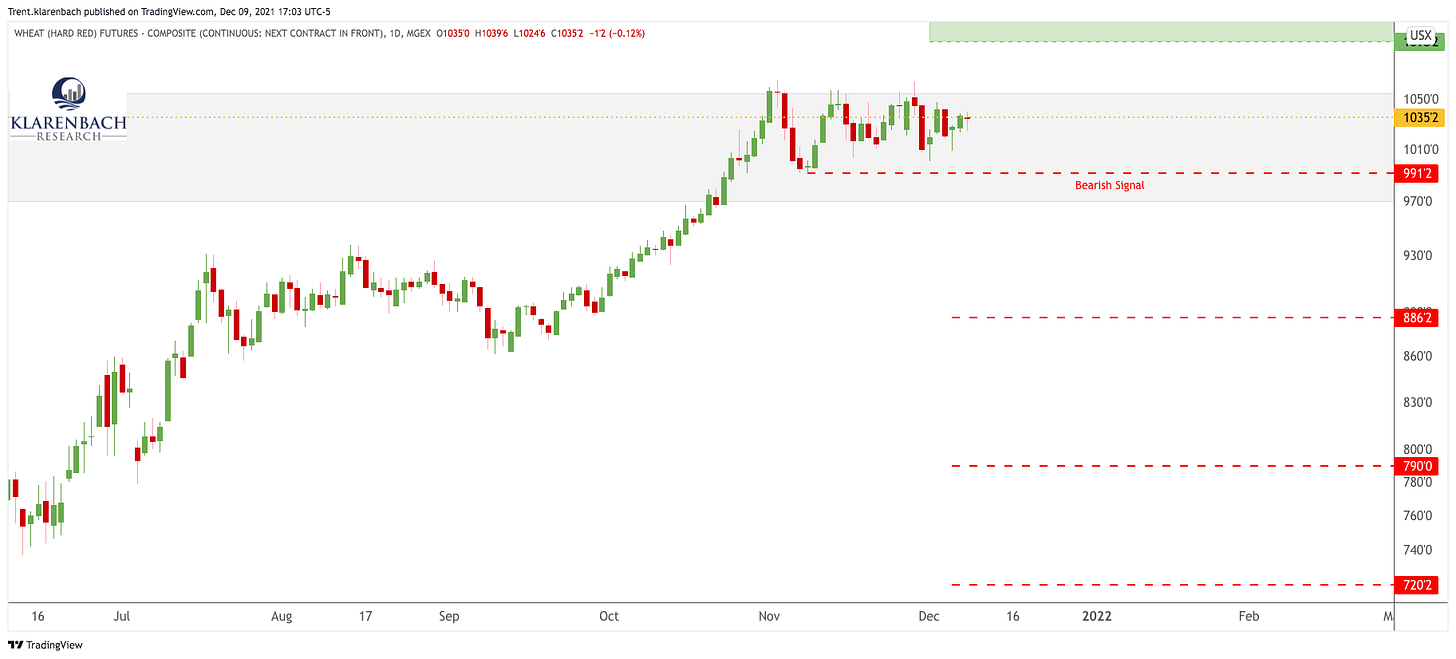
The daily chart is best for showing my bearish signal.
My bearish signal is a new daily close low below 991.
If this occurs, I anticipate reaching the first bearish level of interest.
BULLISH LEVELS OF INTEREST
1055 Bullish above this level
1098 Take full or partial Profits
1271 Take full or partial Profits
1414 Take full or partial Profits
1504 Take full or partial Profits
1718 Take full or partial Profits
1955 Take full or partial Profits
BEARISH LEVELS OF INTEREST
991 Sell Signal
886 Long entry or possible support level
790 Long entry or possible support level
720 Long entry or possible support level
656 Long entry or possible support level
I hope you enjoy this analysis, and I am interested in any feedback you can provide.


