Today, we look at the Corn Futures.
Let us start with the Weekly chart.
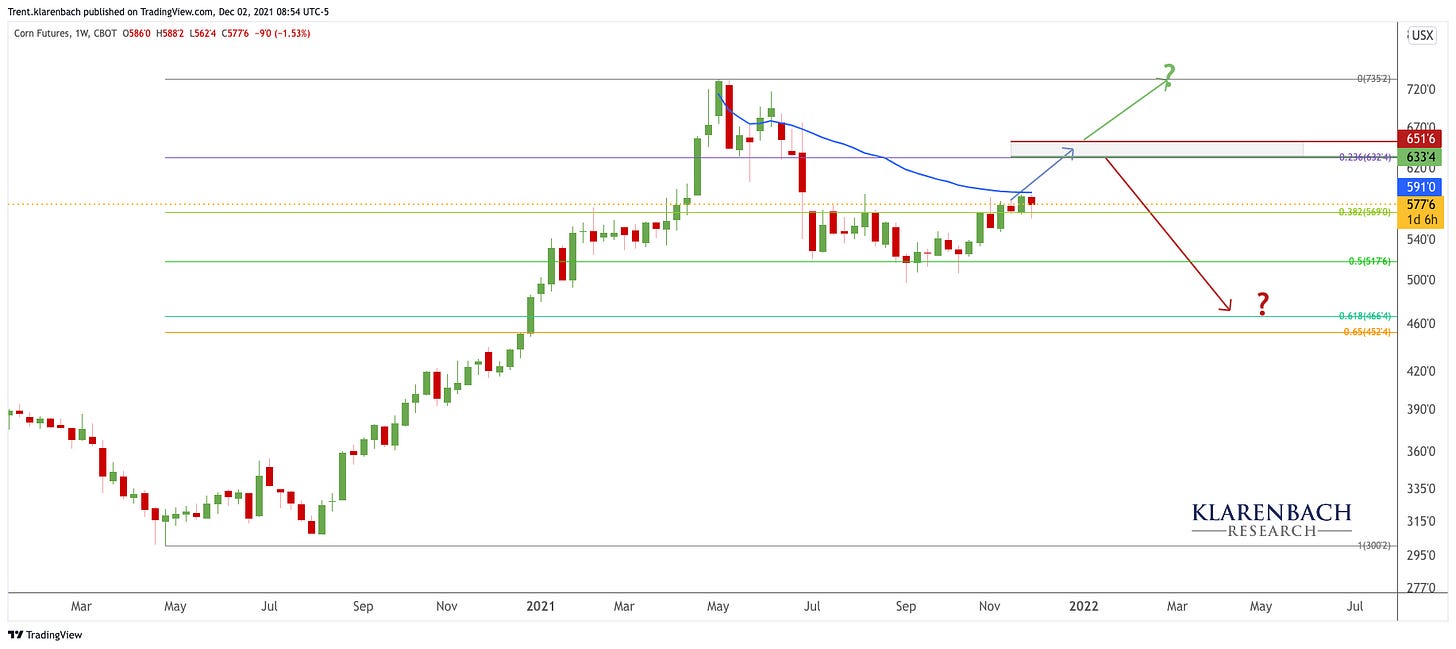
A week or two ago, in the Agriville Commodity marketing forum, I posted bullish and bearish scenarios represented by the blue, green and red line arrows.
We can see that buyers stepped in at the 0.50 Fibonacci Retracement at 517, pushing the price back above the 0.382 Fib level at 569.
The price has spent the past four weeks consolidating between the 0.382 fib level and the blue Volume-Weighted Average Price (VWAP) from the high.
I have the most success looking for trend alignment on multiple timeframes and will drill down lower using the Daily chart below.
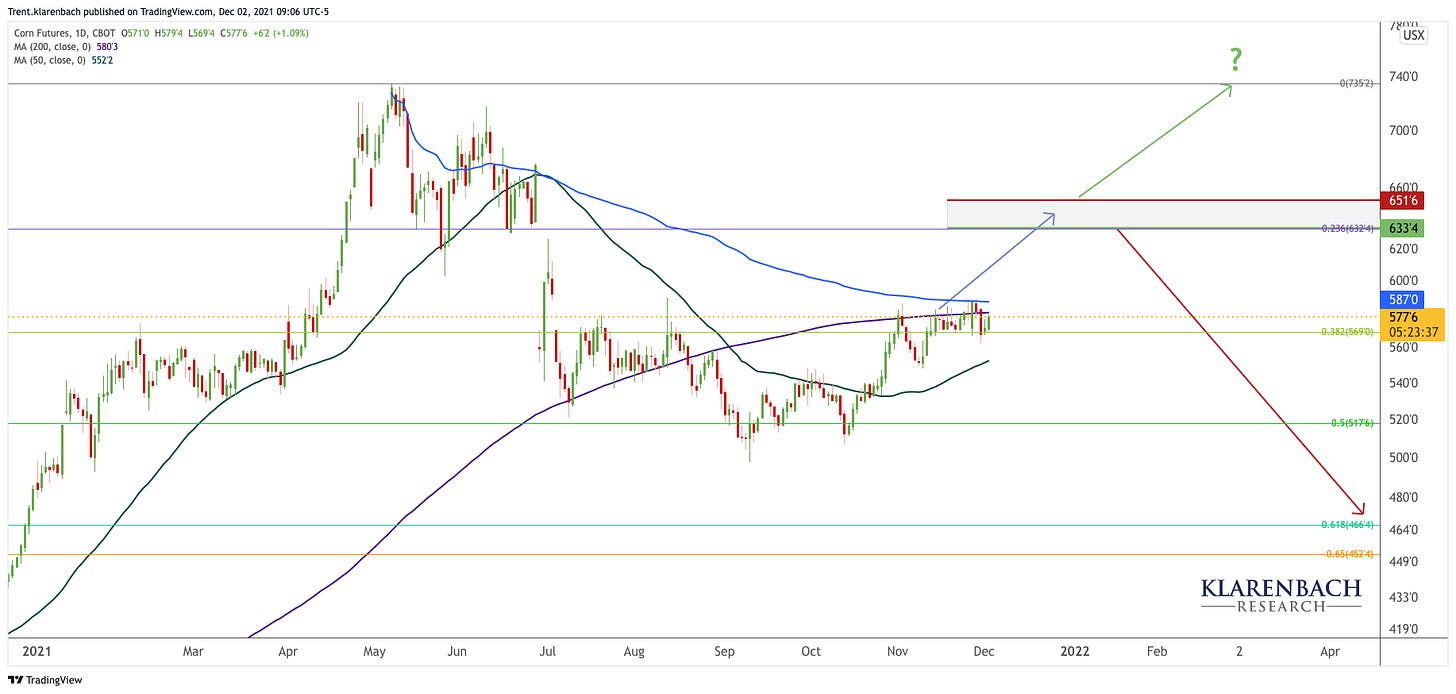
I added the green 50- and 200- Day Moving Averages (DMA).
As you can see, the price is above the rising 50 DMA, which is bullish.
However, notice the price is below the confluence of the blue VWAP from the high and the purple 200 DMA.
The price is being pinched between the 0.382 fib level and these two lines.
I am bearish and have little interest in long positions below a flat to declining 200 DMA.
However, we are consolidating above the previous July-August resistance, which is bullish.
My thesis is that if the price can get a Daily close above the 200 DMA and the blue VWAP from the high, prices can move higher to a target between 633 and 651.
I will reassess at that level whether the price follows the green arrow higher or moves lower to the 0.618 fib level at 466.
If the price cannot close above 587, my next target is the 0.618 fib level at 466.
To Summarize:
BULLISH above 587
Target 633-651
BEARISH below 569
Target 466


