Trent Klarenbach from Klarenbach Research discusses the current trading levels and market analysis of canola on October 7th, 2024.
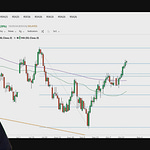
He highlights the significance of the 626 to 631 price range, identified through Fibonacci retracement on a November futures chart, and discusses its alignment with technical indicators such as the 50-day and 200-day moving averages.
Trent advises on potential grain marketing and trading strategies based on these levels, emphasizing the importance of setting stops and managing risks.
He suggests potential price movements and sales tactics if the price moves beyond certain levels, indicating a possible upward trend if certain conditions are met.
Video Timestamps
00:00 Introduction and Market Overview
00:24 Analyzing the Canola Chart
00:30 Fibonacci Retracement and Key Levels
01:07 Moving Averages and Market Sentiment
02:09 Trading Strategies and Recommendations
02:58 Risk Management and Conclusion


