

Bitcoin Wheat Ratio
klarenbachgrainreport.substack.com
Bitcoin Wheat Ratio
Grain Market Technical Analysis

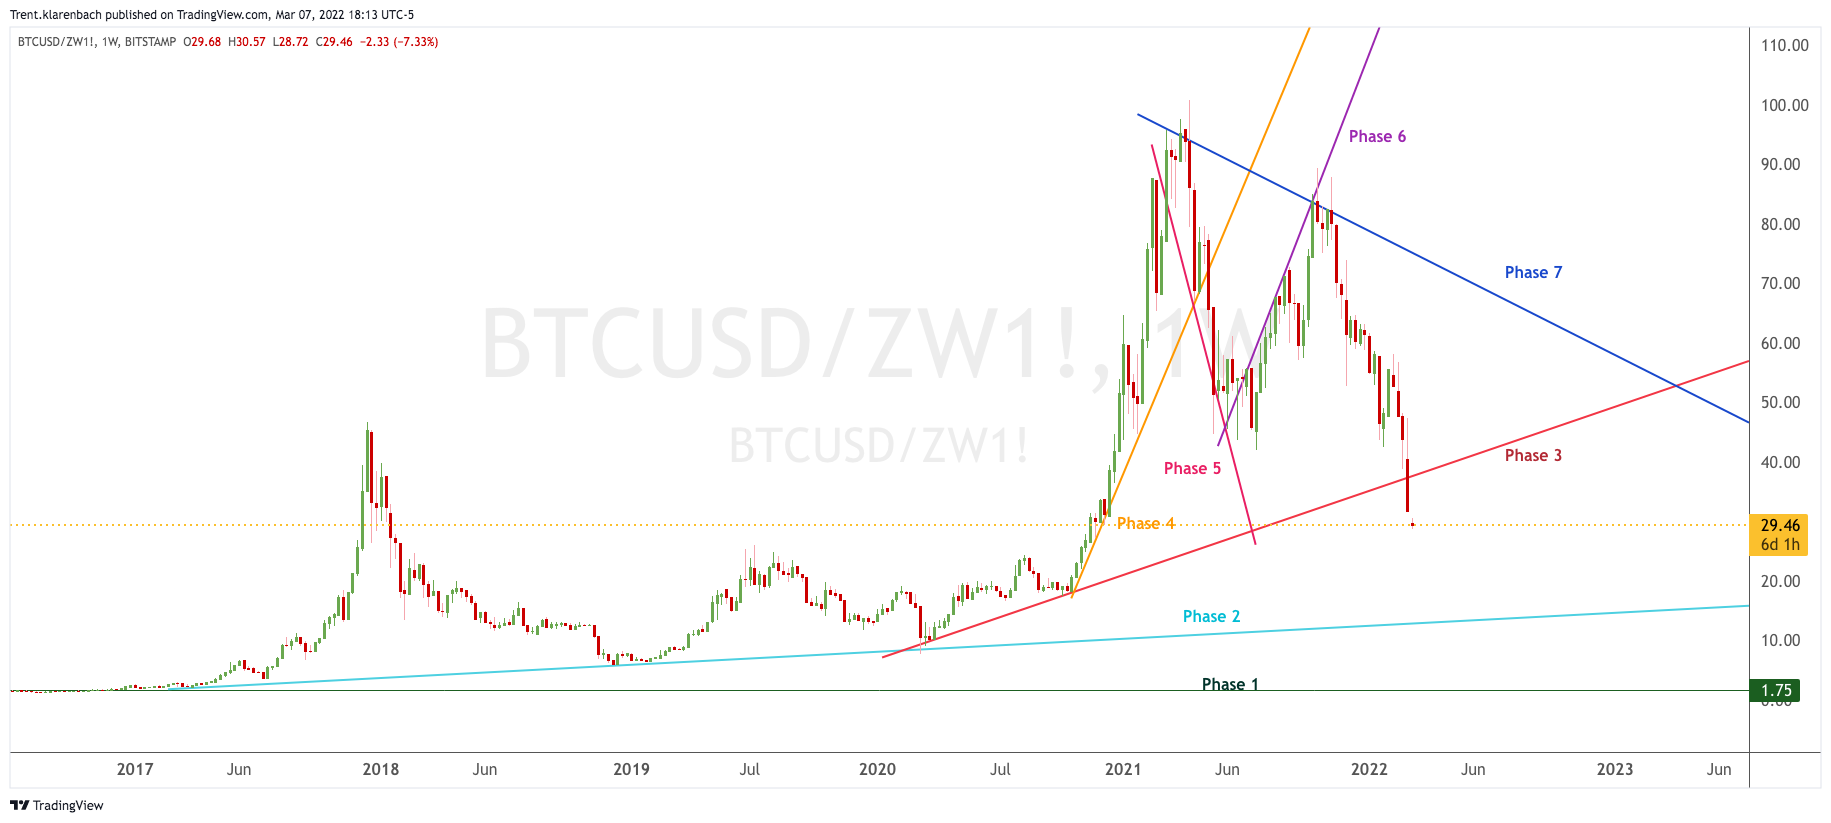
The Bitcoin Wheat Ratio appears to be in a Hyperwave,
Assuming that I have drawn my Hyperwave correctly,
The Phase 3 line is broken.
A weekly close below this line suggests a blue Phase 2 line test.
Hyperwave Theory suggests that a weekly close below the blue Phase 2 line returns to the green Phase 1 line.
Does this suggest a collapse of Bitcoin or runaway wheat prices?
I have seen credible people predicting $40 wheat ........
You can track this idea here