


Bitcoin - Wheat Hyperwave Chart
Removing the Guesswork

Asset allocation can be difficult.
For asset allocation to be effective, one should measure the relative performance between the various investment options.
Several of our readers who invest in Bitcoin will find this chart interesting and perhaps amusing.
We are unsure how many readers decide between Bitcoin or wheat; however, this approach can be practical when assessing investments.
Below is our Bitcoin - Chicago wheat Ratio Hyperwave chart
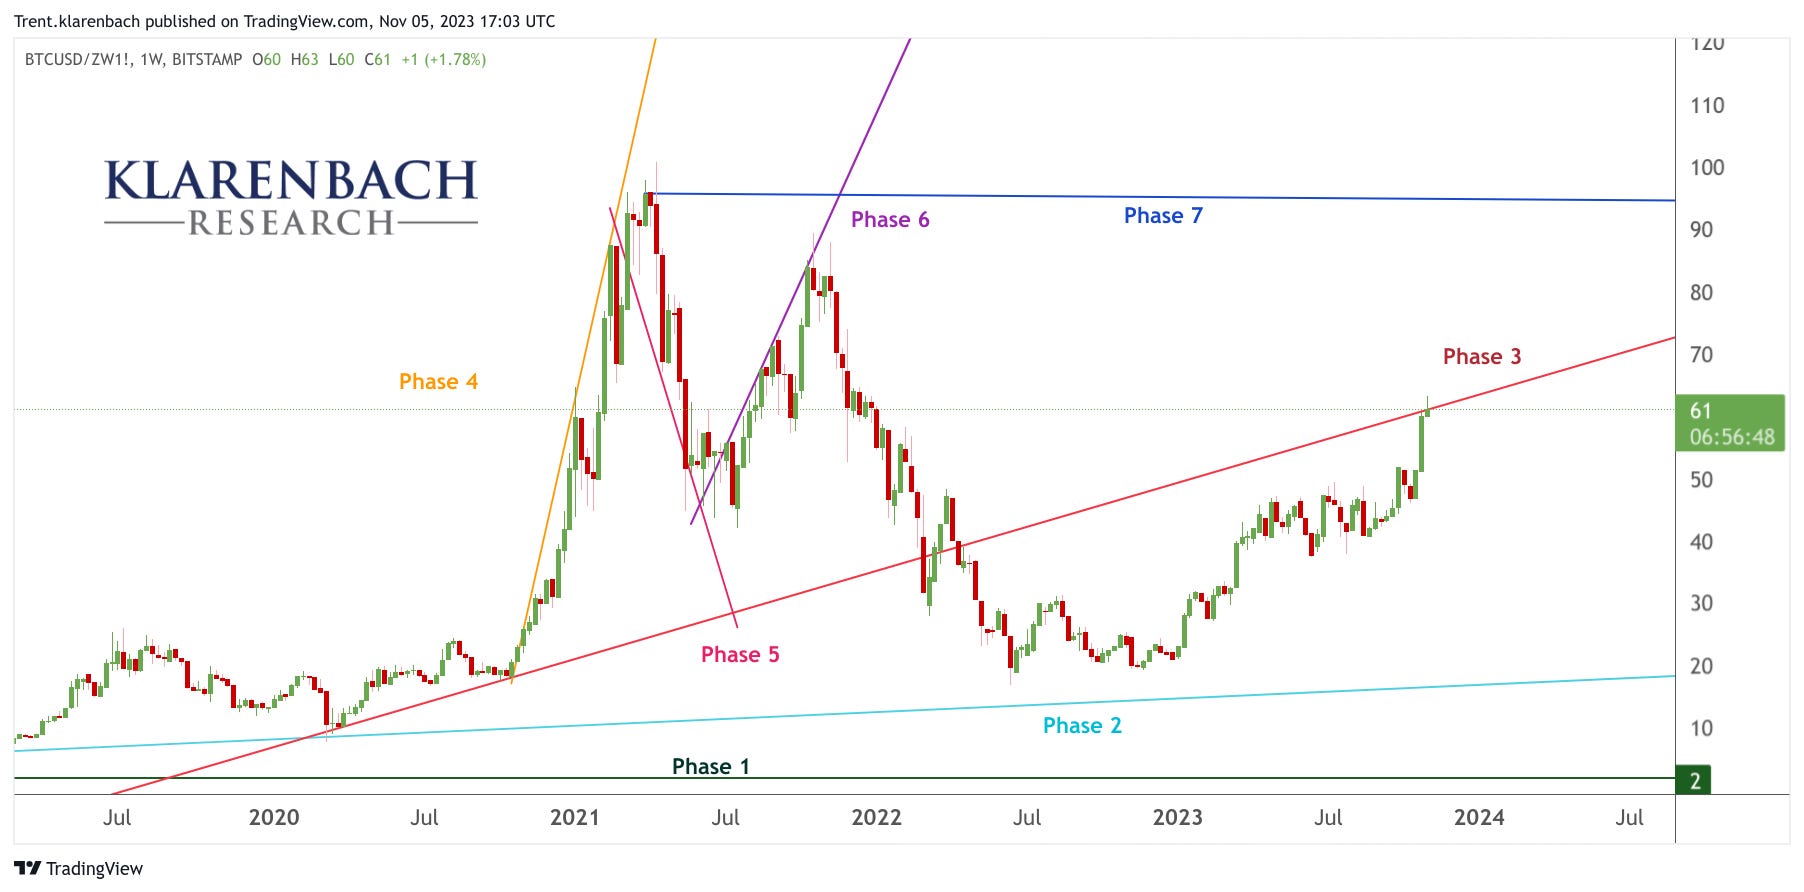
We can see the ratio is testing the Phase 3 line.
A rejection here suggests a possible return to the Phase 2 line.
Hyperwave Theory tells us that a break above the Phase 3 line brings a retest of the Phase 7 line.
Do you Sell wheat and Buy Bitcoin?
Or Sell Bitcoin and Buy wheat?
Something to think about this Sunday morning.
Perhaps this approach will change how you allocate your resources.